Data-Driven Workplace Design: Using Occupancy Intelligence to Create Spaces People Love
Workplace design has traditionally been driven by a combination of architectural standards, executive preferences, and surveys. The result is spaces designed for how people say or think they work, not how they actually work. Occupancy data changes this — providing objective evidence that transforms design from opinion-based to evidence-based.

The Design-Utilization Gap
Most office redesigns follow a predictable pattern: commission a workplace study (typically surveys and focus groups), hire a design firm, build the space, and hope it works. The problem is that employee surveys are a poor predictor of actual behavior.
- People say they want more meeting rooms, but the data shows large rooms are 40% underutilized.
- People say they want quiet zones, but the data shows that social and collaboration areas have the highest occupancy.
- People say they use their desk all day, but the data shows desks are occupied only 4-5 hours of an 8-hour day.
This gap between stated preference and actual behavior is why so many redesigned offices fail to deliver the expected outcomes — and why occupancy data is becoming a non-negotiable input for workplace design.
What Occupancy Data Tells Designers
With desk-level and zone-level occupancy data — gathered by edge AI sensors capable of sub-meter spatial accuracy — designers get a complete picture of how space is actually used.
- Zone heatmaps reveal which areas attract people and which are consistently avoided.
- Dwell time data shows how long people spend in different zone types.
- Movement patterns illuminate how people navigate the floor and where congestion occurs.
- Time-of-day variations show how space usage shifts throughout the day.
- Day-of-week patterns reveal the difference between peak and quiet days.
This data answers the fundamental design questions: What types of spaces do we need more of? What types of spaces are oversupplied? Where should collaborative spaces be located? How should we zone quiet work vs. social space? What meeting room sizes match actual usage?
Reliable occupancy data starts with a well-designed workplace sensing infrastructure — covering sensor placement, data protocols, and integration with space management platforms.
The Right-Sizing Opportunity
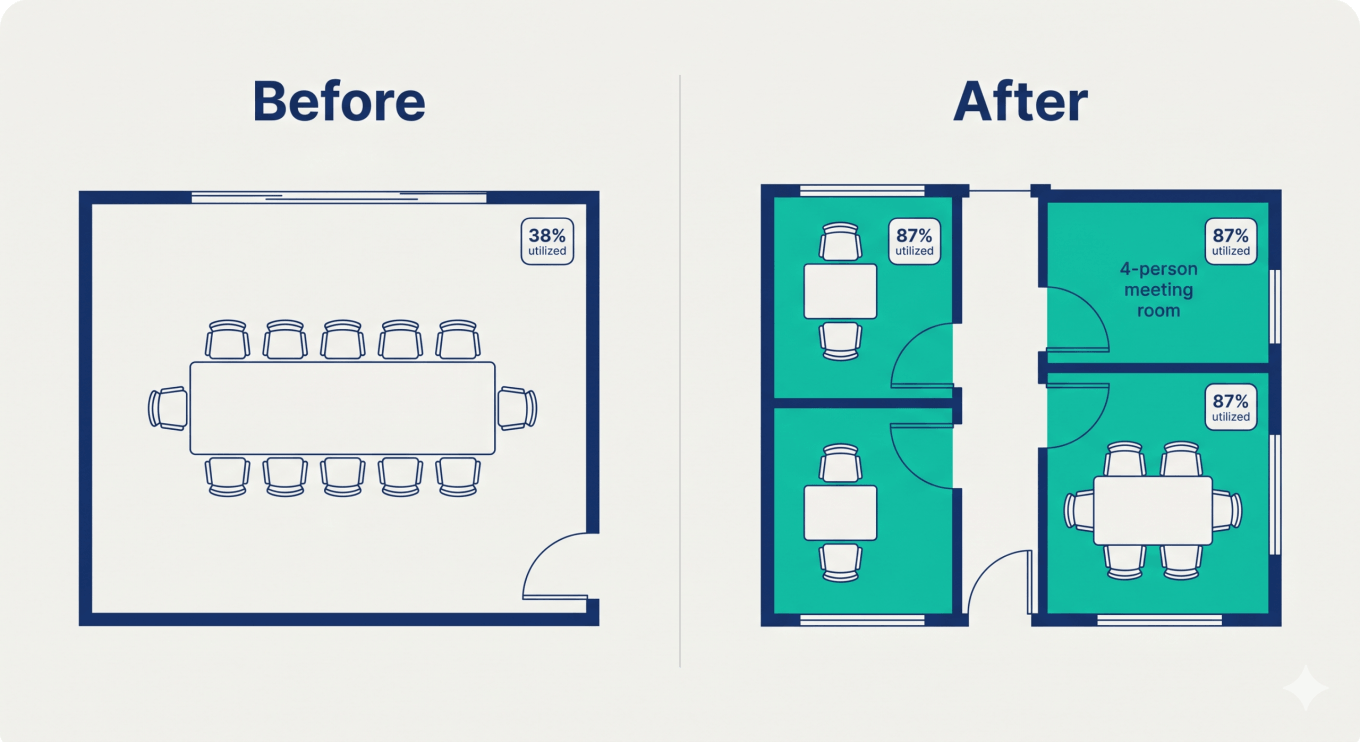
The most impactful design insight from occupancy data is almost always about meeting room mix. Across enterprise offices, the data consistently shows that 60–70% of meetings involve 2–4 people, yet 60–70% of meeting room capacity is in rooms for 8+ people.
This mismatch means large rooms are chronically underutilized (hosting 2-person meetings in 10-person rooms) while small spaces are in constant demand. The design response — converting some large rooms into multiple huddle spaces and phone booths — typically increases effective meeting capacity by 30–40% without adding square footage.
One consistently under-served space type in the data: dedicated quiet zones. Our analysis of focus zones in the modern office covers why most floorplans underestimate the demand for heads-down space.
Case Study: Reallocating for Real-World Use
Consider a recent deployment where a financial services firm utilized a secure, battery-based sensor architecture to audit their newly leased headquarters. By capturing data with 95% accuracy — a crucial threshold to ensure trust in the resulting spatial data layers — they discovered their primary collaboration friction came from Single-Person Occupancy (SPO) in 6-person rooms. Armed with this high-fidelity data, the design team paused the Phase 2 build-out, reallocating 15% of the floorplan from large boardrooms to acoustic pods and 2-person huddle spaces, ultimately saving $200,000 in misaligned construction costs.
Post-Occupancy Validation
Perhaps the most valuable application of occupancy data is post-occupancy evaluation. After a redesign, sensors objectively measure whether the new layout is performing as intended. Are the collaboration zones being used? Did the quiet spaces attract focused workers? Is the new room mix reducing the booking bottleneck?
This closed-loop feedback transforms workplace design from a one-time project into a continuous optimization process — and gives design teams the evidence they need to justify future investments.
Occupancy Data and ESG Reporting
Beyond physical layout optimization and employee experience, evidence-based workplace design yields significant environmental dividends. Occupancy data increasingly feeds into corporate ESG (Environmental, Social, and Governance) reporting — a growing priority for real estate and facilities teams.
Space utilization data directly supports environmental goals: buildings that are right-sized and dynamically managed consume less energy, reduce HVAC runtime, and lower per-occupant carbon footprints. Demand-driven energy management, enabled by the same occupancy sensors that inform design decisions, typically reduces building energy consumption by 20–30%. For organizations with carbon reduction commitments, occupancy-based energy intelligence is a measurable, reportable input to Scope 1 and Scope 2 emissions tracking. The same data that improves design also justifies sustainability investments to boards and ESG auditors.
Getting Started with Data-Driven Design
Transitioning to an evidence-based approach doesn’t require overhauling your entire portfolio overnight. Start by establishing a utilization baseline for a single floor or a known problem area. Deploy ceiling-mounted edge AI sensors to capture accurate telemetry over a 60-to-90-day period. This initial spatial data layer will provide the immediate insights needed to prove the ROI of the technology and guide your next design iteration.
Design workplaces based on evidence, not assumptions. PointGrab occupancy data gives designers the real-world usage insights that create spaces people actually love.
Start with the right baseline metrics: your employee-to-seat ratio and return-to-office occupancy data are the foundation of any data-driven design process.
Frequently Asked Questions
How should occupancy data influence workplace design?
Occupancy patterns reveal how spaces are actually used, informing decisions about layout, capacity, amenities, and zone allocation.
What design decisions benefit most from occupancy data?
Layout changes, desk-to-seat ratios, meeting room sizing, quiet zone placement, and collaboration area planning all benefit from usage insights.
How do you identify underutilized design features?
Occupancy data combined with user feedback reveals which designed features aren’t being used, informing future design iterations.
Can occupancy data justify design changes?
Yes, data showing low utilization of certain areas or features provides strong justification for redesign investments.
How does occupancy inform open vs. closed space decisions?
Usage patterns reveal whether open layouts, collaboration zones, or private areas are needed, guiding architectural decisions.
What’s the role of employee feedback alongside occupancy data?
Occupancy data shows what spaces are used; employee feedback explains why, together providing comprehensive design insights.
