The Ghost Town Paradox: Why Security Badge Data is Ruining Your Real Estate Strategy
Every Corporate Real Estate leader has experienced the “Ghost Town Paradox.” You walk onto the fourth floor on a Tuesday at 2:00 PM. The floor is painfully quiet. Banks of desks sit empty. Yet, when you pull the weekly attendance report, the data claims the building was at 85% capacity.
How can the data be so completely divorced from reality?
Because you are relying on a security badge swipe. For years, the simple “badge-in” has been the undisputed metric for office attendance. But as organizations transition from merely counting heads to optimizing high-performance (and highly expensive) workspaces, a harsh reality is setting in: a security system was designed to keep bad actors out, not to tell you how your employees are using the space within.
If you are basing multi-million dollar real estate decisions—renewals, consolidations, or redesigns—on badge data, you are working with a fundamentally flawed, heavily skewed picture. Here is why.
1. The Legal Minefield and the “Data Begging” Cycle
The first hurdle with badge data isn’t even the data itself—it’s the geopolitical nightmare of getting your hands on it.
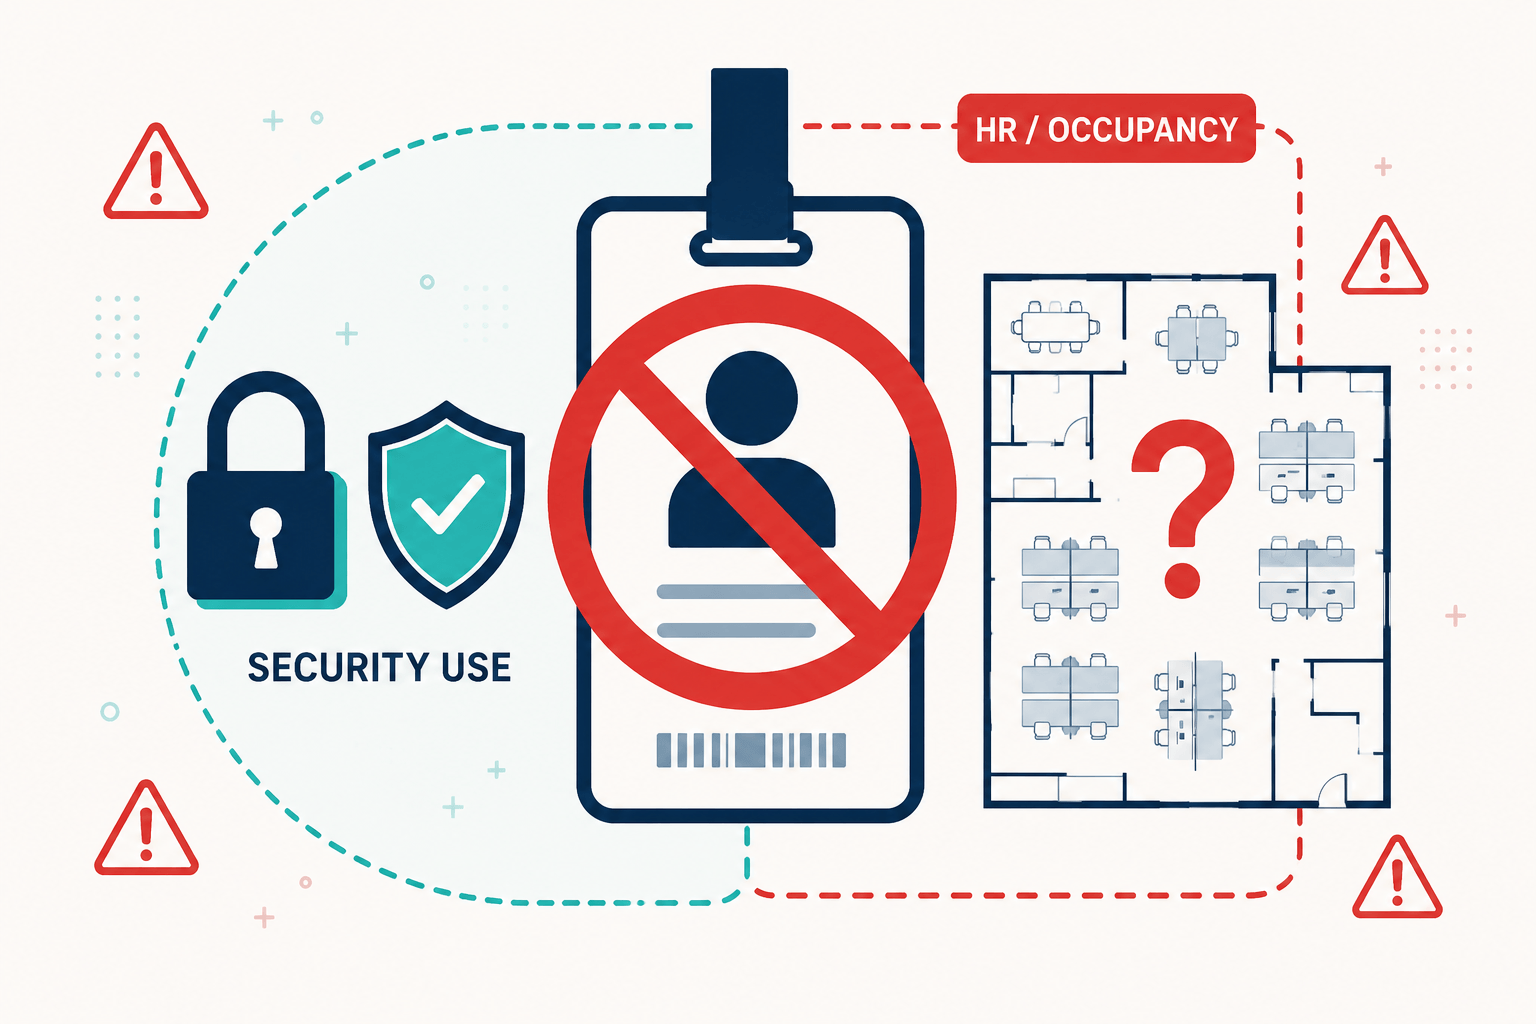
Because badge data is tied to personally identifiable information (PII), it sits behind a wall of security and HR scrutiny. You ask for building occupancy trends; HR hears “employee surveillance.”
While tracking individual attendance via badges is standard practice in the US, try rolling out a global dashboard. In Western Europe, the UK, and the Nordics, strict privacy laws like GDPR make this a non-starter. If you operate in Germany, for instance, you have to get past the Betriebsrat (Works Council). Suggesting that management will analyze when employees scan their badges is a fast track to a months-long legal standoff. For a deeper look at how privacy regulations affect workplace data collection, see our guide to occupancy sensors and GDPR.
Even where it is legally permissible, accessing this data is an operational slog. CRE teams find themselves stuck in the “data begging” cycle: submitting tickets to IT or Security, waiting weeks for a batch report from a legacy access control system (like Lenel or S2), and then waiting again while HR sanitizes the PII. By the time you get the spreadsheet, the data is a month old and practically useless for dynamic space planning.

2. Built-In Blindspots: Tailgating, “Badge Coffee,” and the Missing Exit
Even if you successfully navigate the HR gauntlet, the data you receive is mathematically compromised from the start. Badge mechanics simply do not align with modern human behavior.
Consider these everyday scenarios that destroy your data integrity:
- The “Badge Coffee” Phenomenon: An employee swipes in at 9:00 AM, drops their bag, grabs a coffee with a colleague, and leaves for an off-site client meeting or heads back to their home office by 10:00 AM. The badge data registers them as present for the entire day.
- The “Pizza Friday” Tailgating Effect: One person swipes to unlock the glass doors, and three colleagues walk in behind them out of politeness. Your security system counted one person. However, your HVAC system, cafeteria, and restroom facilities are now supporting four.
- The One-Way Black Hole: Most offices only require employees to badge in. Without badge-out data, calculating actual building churn, average dwell time, or peak concurrent occupancy is essentially a guessing game. Industry estimates suggest that without exit data, duration assumptions can skew utilization metrics by upwards of 30–40%.

3. The Great Mismatch: Attendance vs. Utilization
The most critical failure of badge data is philosophical. Security systems care who crossed the threshold. Real estate and workplace strategists care how the space is being consumed.
A scenario: Imagine you just spent $2 million retrofitting a floor to be a state-of-the-art “collaboration hub,” reducing individual desks by 40%. The badge data shows 500 people entered the building on Wednesday. The project looks like a massive success.
What the badge data doesn’t show you is the “Phone Booth Hunger Games” happening inside. It doesn’t show that those 500 people completely ignored the soft-seating collaboration zones and instead spent the entire day fighting over the few remaining acoustic pods to take Zoom calls.
Badge data is entirely blind to intent and experience. It cannot distinguish between an employee who spent six hours doing deep, focused work at a dedicated desk and one who spent six hours jumping between overbooked conference rooms. It misses the campus-hoppers who badge into Building A but spend the afternoon in Building B without swiping. It ignores the dozens of contractors and clients walking around on generic visitor passes.
This is exactly the kind of challenge that a purpose-built spatial data layer is designed to solve—capturing how space is actually consumed, not just who passed through the door. And when you understand true utilization, you can start building a credible business case for occupancy intelligence rather than relying on data that was never designed for this purpose.
The Bottom Line
Badge data might appease an executive board asking if the return-to-office mandate is being acknowledged, but it will never tell you if your office design is actually working.
To make intelligent decisions about leases, redesigns, and resource allocation, real estate leaders need true spatial intelligence. They need anonymous, highly accurate sensor data that measures the actual pulse of the building—desk by desk, room by room—rather than just counting who walked through the front door.
Ready to move beyond badge data? PointGrab’s edge AI occupancy sensors deliver anonymous, room-level utilization data—no PII, no data-begging cycle, no blind spots. See how.
Frequently Asked Questions
What is the “Ghost Town Paradox” in corporate real estate?
The Ghost Town Paradox describes a situation where a floor appears nearly empty but badge-based attendance reports claim the building was at 85% capacity. It highlights the fundamental disconnect between who swiped in and how the space is actually being used.
Why is security badge data unreliable for office occupancy planning?
Badge data only records who entered the building—not whether employees stayed, how they used the space, or when they left. Tailgating, early departures, and the absence of badge-out data all combine to inflate apparent occupancy figures, often by 30–40% or more.
What is tailgating and how does it distort badge data?
Tailgating occurs when one person swipes their badge and colleagues walk through the door behind them without swiping. The security system counts one person, while the building is actually supporting multiple employees—creating a systematic undercount of true occupancy.
Can badge data tell you how your office space is actually being used?
No. Badge data is blind to intent and experience. It cannot distinguish between an employee doing deep focused work at a dedicated desk and one spending the day fighting for overbooked conference rooms. It tracks building entry, not space utilization.
What is the “Badge Coffee” phenomenon?
The “Badge Coffee” phenomenon describes an employee who swipes into the office in the morning, drops their bag, grabs a coffee, and then leaves for an off-site meeting or heads home—yet the badge system records them as present for the full day.
What should replace badge data for real estate decision-making?
Corporate real estate leaders need anonymous, highly accurate sensor data that measures actual space utilization—desk by desk, room by room—in real time. Edge AI occupancy sensors provide this spatial intelligence without relying on personally identifiable data tied to individual employees.
How much can badge data skew utilization metrics?
Significantly. Without exit data, duration and concurrent occupancy assumptions can be skewed by 30–40% according to industry estimates. When you add the effects of tailgating and the “Badge Coffee” phenomenon, the true picture of how your office is being used can look very different from what badge reports suggest.
