The Complete Guide to Workplace Sensing Infrastructure: Architecture, Protocols, and Data Flow
By Amir Einav, CEO, PointGrab
Workplace sensing infrastructure refers to the integrated technical framework—encompassing sensors, communication protocols, edge processing, and data integration layers—that enables organizations to capture, process, and act on real-time occupancy and utilization data across buildings and spaces. Unlike traditional sensor deployments focused on point solutions, modern sensing infrastructure is an architectural discipline that demands careful consideration of data flow, system interoperability, privacy architecture, and long-term scalability. This guide explores the five-layer model that underpins enterprise-grade workplace sensing, the critical difference between wired and wireless deployments, and how to build a future-proof sensing stack that remains vendor-agnostic and privacy-first.
Why Infrastructure Architecture Matters More Than the Sensor
For decades, the question in commercial real estate and workplace operations was simple: ‘Which sensor should we buy?’ The focus was on hardware—infrared occupancy sensors, CO2 monitors, or thermal imaging systems. Today, that question has fundamentally shifted.
IT directors, system integrators, and workplace leaders are now asking: ‘How does this data flow through our infrastructure? Can it integrate with our existing BMS? Will we be locked into a single vendor’s platform? How is privacy handled? How do we manage the deployment?’ The sensor is no longer the bottleneck—the architecture is.
This shift reflects a maturation of the workplace technology market. Early adopters often chose sensor systems based on accuracy specs alone, only to discover later that proprietary data formats, closed APIs, and vendor lock-in limited their ability to integrate the data meaningfully into their operations. A building with 500 perfectly accurate sensors is worthless if the data stays trapped in the vendor’s dashboard.
The hidden cost of proprietary platforms extends far beyond the initial hardware purchase. When occupancy data cannot flow seamlessly into your Building Management System (BMS), Integrated Workplace Management System (IWMS), or custom analytics platform, you’ve essentially created a siloed data island. Your facilities management team operates from one dashboard, your real estate planning team from another, and your space allocation from a third. The result: fragmented decision-making, missed opportunities for cost optimization, and technology debt that compounds over years.
Smart buildings are built on data architecture first, hardware second. This guide walks you through the layers of that architecture, showing you how to evaluate sensing systems not by sensor performance alone, but by the broader ecosystem they enable.
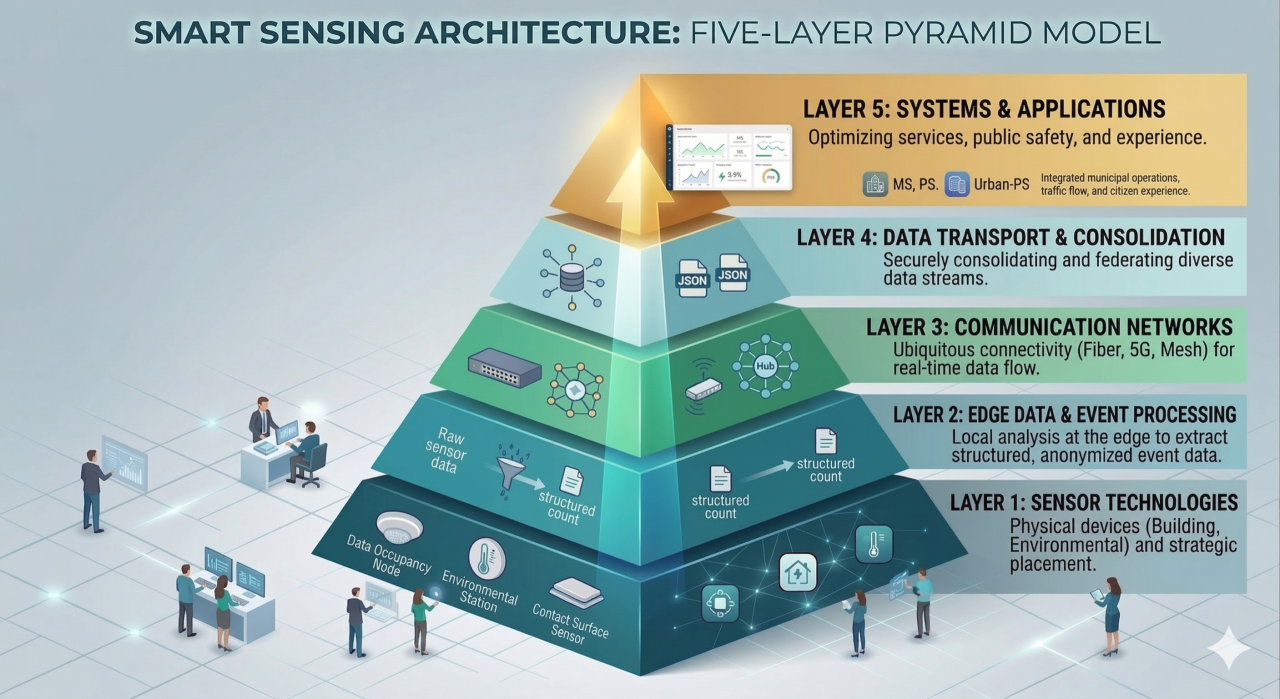
The Five Layers of Workplace Sensing Infrastructure
Enterprise-grade workplace sensing infrastructure is built on five distinct but interconnected layers. Understanding each layer—and how data flows between them—is essential for designing systems that scale, integrate, and remain adaptable over time.
Layer 1: Physical Sensing
Physical sensing is where data originates. In workplace environments, this typically includes occupancy sensors (PIR, thermal imaging, or optical detection), environmental sensors (temperature, humidity, CO2), and specialized sensors (people count on virtual traffic line). The choice of sensor technology influences not just accuracy, but also power consumption, installation complexity, and privacy implications.
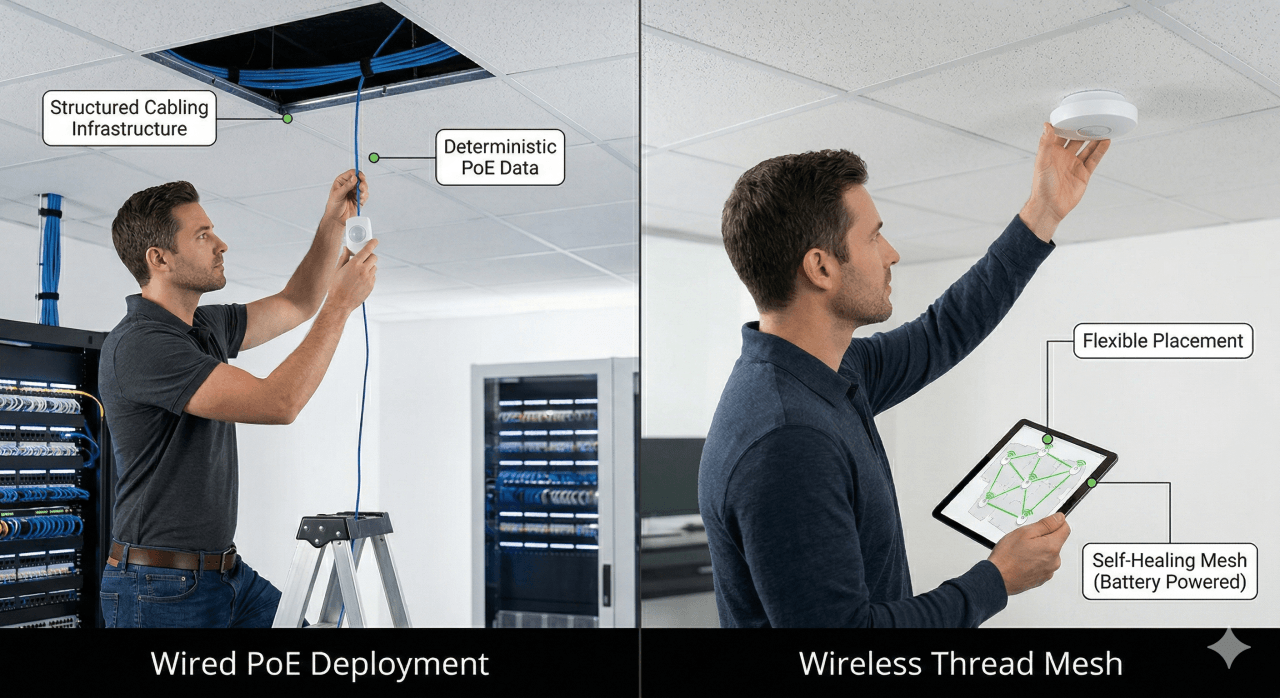
Wired deployments (Power-over-Ethernet) offer consistent power, deterministic data transmission, and simplified network management. Sensors are physically connected to network infrastructure, eliminating battery concerns and ensuring reliable communication.
Wireless deployments provide flexibility in placement and simplified installation but require careful planning around mesh networking, battery management, and radio frequency interference. Modern wireless protocols like Thread are designed specifically for building environments.
Layer 2: Edge Processing
Raw sensor data is often noisy, high-volume, and unsuitable for direct transmission or storage. Edge processing—applying algorithms and intelligence at the sensor or gateway level—transforms raw data into actionable signals. This layer is where occupancy is calculated from raw optical imaging, where environmental outliers are filtered, and where privacy-sensitive data can be processed locally before transmission.
Edge AI processing means that algorithms run directly on the sensor or gateway, never transmitting raw data to the cloud. This is the foundation of privacy-by-design architecture. For occupancy sensing, this means a sensor detects people and sends only the count (not images or raw thermal data).
Cloud-based processing requires raw or minimally processed data to be sent to centralized servers where machine learning models perform feature extraction and analysis. This approach offers flexibility and the ability to retrain models, but raises privacy and data residency concerns.
Layer 3: Communication Protocols
Once data is processed at the edge, it must be transmitted from sensor to gateway, or from gateway to the network infrastructure. The choice of communication protocol affects reliability, latency, power consumption, and installation requirements. Here’s a comparison of the primary protocols used in workplace sensing:
| Protocol | Type | Best For | Power/Range Trade-off |
| Power-over-Ethernet (PoE) | Wired | Deterministic, high-density deployments | Unlimited power, excellent reliability |
| Thread | Wireless Mesh | Building-wide coverage, low-latency mesh | Low-power mesh, 250m range, self-healing |
| Wi-Fi (802.11) | Wireless | Existing infrastructure, higher bandwidth | Higher power, variable range 30-100m |
| BACnet | Building Protocol | HVAC/BMS integration | Specialized, limited to building systems |
| Zigbee | Wireless Mesh | Legacy systems, simple devices | Low-power, limited range, aging standard |
| LoRaWAN | Wide-area Wireless Mesh | Large-scale smart buildings, long-range low-power deployments | Very low power, long range, deep wall penetration; rising standard in smart buildings |
| Cellular (5G/LTE) | Wide-area wireless | Remote buildings, disconnected spaces | Highest power, highest cost, external coverage |
For most workplace sensing deployments, the choice comes down to wired infrastructure (PoE) or wireless mesh (Thread). PoE offers superior reliability and unlimited power but requires network infrastructure. Thread provides flexibility and low power consumption with self-healing mesh capabilities but demands careful planning around coverage and interference.
LoRaWAN is a rising standard gaining traction in smart buildings, particularly where long range, deep wall penetration, and ultra-low power consumption are priorities—making it well-suited for large-scale or multi-building deployments.
Layer 4: Data Transport
Once occupancy data reaches the network infrastructure, it must be transported to backend systems—BMS, IWMS, analytics platforms, or custom applications. Two primary patterns dominate: publish-subscribe messaging (MQTT) and request-response APIs (REST/WebHooks).
MQTT (Message Queuing Telemetry Transport) is a lightweight publish-subscribe protocol ideal for high-volume, real-time sensor data. Sensors publish data to topics (e.g., building/floor3/office_12/occupancy), and any system subscribing to those topics receives updates immediately. MQTT is efficient, supports offline message queuing, and decouples sensors from applications. This is the industry standard for IoT platforms and the foundation of software-agnostic sensing infrastructure.
REST APIs and WebHooks are request-response patterns where applications explicitly query the sensor system or sensors push data to subscribed endpoints. REST is more familiar to traditional enterprise applications and enables fine-grained security controls, but at the cost of higher latency and bandwidth consumption.
Many modern sensing systems support both: MQTT for real-time data streaming in local settings and REST for ad-hoc queries or integration with large variety of systems. This flexibility is a hallmark of software-agnostic architecture.
Layer 5: Analytics & Integration
The final layer is where occupancy data becomes actionable insight. This includes Building Management Systems (BMS) for HVAC optimization, Integrated Workplace Management Systems (IWMS) for space planning and utilization reporting, Computer-Aided Facility Management (CAFM) systems for operations management, Space Booking and Employee Experience apps and custom analytics dashboards for executive reporting.
A software-agnostic sensing infrastructure ensures that occupancy data flows smoothly into any of these systems without custom integrations or middleware. Standardized data formats (JSON, industry-specific schemas) and open API patterns make this possible. The result is a genuine single source of truth for space utilization across your organization, building and space types.
Wired vs Wireless: An Architecture Decision, Not Just a Hardware Choice
The wired-versus-wireless decision is often framed as a binary choice: pick one or the other. In reality, it’s an architectural decision that should reflect your organization’s infrastructure maturity, space types, and operational constraints. Most enterprise deployments benefit from hybrid approaches.
Power-over-Ethernet Infrastructure
PoE infrastructure requires network cabling to be extended to sensor locations. For modern buildings with structured cabling in drop ceilings and managed server rooms, this is often straightforward. For older buildings or spaces with no network infrastructure, it requires renovation.
Benefits: Unlimited power eliminates battery concerns. Data transmission is deterministic—no interference, no dropout, no missed occupancy readings. Network switches provide native security and access control. Cabling is hardened and centrally managed.
Trade-offs: Higher upfront infrastructure cost. Installation is disruptive (cable runs, conduit, patch management). Density is limited by available network switch ports.
Thread Mesh Networking for Wireless Deployments
Thread is a low-power, self-healing mesh protocol designed specifically for building IoT. Unlike Wi-Fi (which requires separate access points), Thread devices form their own mesh network, automatically routing around obstacles and failed devices. A single Thread border router provides connectivity to the wider network; sensors handle the routing internally.
Benefits: Simple installation—no cabling required. Low power consumption extends battery life to 2-5 years. Self-healing mesh ensures coverage even if individual devices fail. Quick deployment in new spaces or temporary configurations.
Trade-offs: Battery management adds operational complexity. Mesh coverage requires sufficient device density. Radio frequency interference from Wi-Fi or other wireless systems can degrade performance. Firmware updates across a large mesh network require coordination.
Hybrid Deployments: When to Use Both
The most robust deployments combine wired and wireless infrastructure. Use PoE in high-density areas (open offices, meeting rooms) and traffic count and where network infrastructure is going to be deployed (new build) or exist. Deploy wireless (Thread) in remote areas, temporary spaces, or where cable runs are impractical (existing building). This approach provides:
- Deterministic coverage in core zones via PoE, flexible coverage via Thread
- Gateway redundancy: PoE devices can serve as Thread border routers, eliminating single points of failure
- Cost optimization: PoE for mission-critical spaces, wireless for supplementary coverage
- Operational simplicity: One unified data platform regardless of transport mechanism
Total Cost of Ownership Considerations
Comparing wired and wireless requires looking beyond initial hardware and installation costs:
- PoE: Lower ongoing operational costs (no battery replacements), but higher upfront infrastructure investment. Network infrastructure is amortized over many years.
- Wireless: Lower installation costs, but battery replacement cycles (every 4 years across hundreds of sensors) add ongoing expense. Mesh optimization and firmware management require technical attention.
- Hybrid: Balanced approach—leverage existing infrastructure, extend via wireless where needed. Higher complexity in network design but optimal TCO.
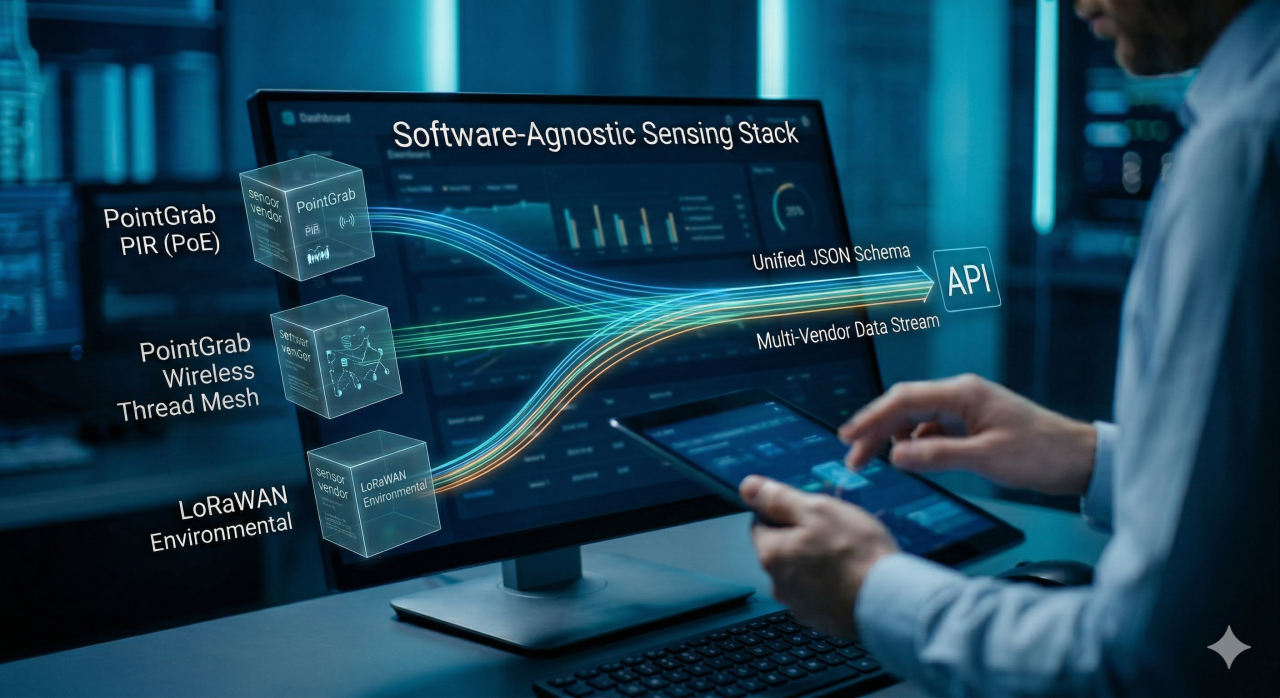
The Case for Software-Agnostic Sensing
Software-agnostic sensing, coming from any deployment type of occupancy sensor, means that occupancy data flows freely between the sensor infrastructure and any application that needs it, without proprietary integrations, custom middleware, or vendor lock-in. This is where infrastructure architecture determines business flexibility.
Why Data Portability Matters
Consider a typical scenario: You deploy an occupancy sensing system, integrate it with your BMS, and over time, a better analytics platform emerges, maybe AI based. With proprietary infrastructure, switching is painful—your data is locked in the vendor’s format, your BMS integration is tightly coupled, and migration costs are high. The lock-in means you will need to wait for the vendor roadmap to take advantage of the latest technology innovation and have less room in commercial improvement. With software-agnostic infrastructure, you simply point the new analytics platform to the same API stream. Your data moves freely; the application vendor choice remains yours.
Data portability also protects against vendor failure. If your sensing platform provider goes out of business or discontinues a product line, you’re not stranded—your data is in open formats (JSON, CSV, time-series) that any new vendor can consume. Your infrastructure investment remains an asset, not a liability.
Avoiding Vendor Lock-in at the Infrastructure Level
Vendor lock-in occurs at multiple levels. At the sensor level, choosing a proprietary wireless protocol locks you into single vendor technology. At the data layer, proprietary APIs lock you into that software platform. True software-agnostic architecture means:
- Open communication protocols: MQTT, REST, BACnet—not proprietary formats
- Open data standards: JSON-LD for metadata, ISO/IEC standard schemas for occupancy data
- Multi-source support: Your analytics platform ingests data from multiple sensor vendors simultaneously and even fuse data into new insights
- Portability guarantees: Published SLAs for data availability, export and standard formats
Open Architecture Design Principles
When evaluating sensing platforms, apply these architecture principles:
- Separation of concerns: Sensors handle detection, gateways handle local processing, the data plane (MQTT/APIs) handles transport, analytics layers handle interpretation
- Loose coupling: Each component works independently; failure in one doesn’t cascade to others
- Open data formats: No proprietary schemas; use industry standards and a publish data model
- Modular procurement: You can swap sensor manufacturers, application platforms, or integration tools without rearchitecting the whole system
Privacy by Architecture
Privacy is not a feature you add to a sensing infrastructure—it’s an architectural decision made at design time. The question of ‘what data exists where’ shapes everything downstream: compliance, employee trust, data residency, and regulatory exposure.
Edge Processing as a Privacy Architecture Choice
Edge processing means that sensitive data processing happens at the sensor or gateway level within enterprise network, not in the cloud. For occupancy sensing, this means a sensor image never transmits the raw image or thermal data. Instead, local AI models detect people and transmit only the occupancy count and position metadata.
Privacy benefits of edge processing:
- Raw data never leaves the sensor: No images, no thermal data, no recognition transmitted to cloud systems
- Data minimization at source: Only occupancy counts and anonymized spatial information flow downstream
- Reduced compliance surface: Fewer data processors, clearer data residency, simpler audit trails
- Employee trust: Occupants can see the sensor and understand what data it’s collecting locally
- Regulatory alignment: GDPR’s data minimization principle and CCPA’s consumer privacy protections are easier to satisfy
Data Minimization at the Sensor Level
Data minimization is a core privacy principle: collect and transmit only the data necessary for your business purpose. For workplace occupancy, the business purpose is typically: ‘How many people are in this space?’ or ‘Is this desk now occupied?’ Not: ‘Who specifically is in this space, when did they arrive, and where did they go?’
Edge AI enforcement means this principle is baked into the sensor itself. The sensor’s AI model is trained to extract only detected occupancy (count and rough position), discarding facial recognition data, identification, and detailed movement tracking. What the sensor doesn’t compute, it can’t transmit. This is privacy by design.
Compliance Implications (GDPR, CCPA)
GDPR requirements include data minimization, purpose limitation, and storage limitation. Edge processing satisfies data minimization by ensuring that personal data (or data that could identify individuals) is never stored or leaves the sensor. Purpose limitation is enforced by the sensor’s AI model, which is designed to extract only occupancy. Storage limitation means occupancy counts can be stored for operations, but detailed tracking data isn’t stored in the first place.
CCPA requirements center on consumer rights: right to know what data is collected, right to deletion, right to opt-out. Edge AI helps here by being transparent (we collect occupancy counts, not individual tracking) and by minimizing retention (occupancy data for analytics is aggregated and historical, no PII).
Cloud vs Edge: What Data Exists Where
A critical architectural question: At what point does data leave the local building network? In an edge-first architecture:
- At the sensor: Raw data (images, thermal arrays) exists only in memory, processed instantly and discarded. No file is created.
- At the gateway: Occupancy counts and derived metrics are stored locally (for 24-48 hours) and streamed to downstream systems
- In the cloud: Only anonymized data reaches cloud analytics—raw spatial data, aggregations (30 mins, day etc), weekly trends
- In the organization: Your BMS and IWMS run on-premises or in a controlled cloud environment, with clear data governance policies
This layered approach means that privacy is kept in each level, and the cloud systems provide analytics, alerting, and insights—they’re fed aggregated data, not raw event streams.
Building a Future-Proof Sensing Stack
Workplace sensing infrastructure is a long-term investment. A building deployed today should remain functional and upgradeable for 5-10 years. Future-proofing requires architectural decisions made now.
Designing for Scale (10 Sensors to 10,000)
Many organizations start small—a pilot project in one floor with 50 sensors. Success leads to expansion: 10 floors, then the entire building, then multiple campuses. Infrastructure designed for 50 sensors often breaks when scaled to 5,000. Avoid this by designing for scale from the start:
- Sensor naming and hierarchy: Establish a consistent naming scheme (building/floor/zone/space) from the start; don’t rename later
- Network architecture: Plan PoE switch capacity for 3x current deployment; wireless mesh should be designed with coverage redundancy
- Metadata management: Use a configuration management database (CMDB) and change logs to track sensor types, locations, and status; this becomes critical at scale
- Monitoring: Instrument your infrastructure with sensor health checks, availability alert in every layer, network visualization, and data quality metrics
Upgradeability and Firmware Management
Sensors are not static hardware; they’re platforms. Over time, firmware updates fix bugs, improve accuracy, add new features, and patch security vulnerabilities. Plan for this upfront:
- Over-the-air (OTA) updates: Sensors should support firmware updates without manual intervention
- Staged rollouts: Expect rolling updates to a subset of sensors first; monitor for issues before full rollout
- Backward compatibility: New firmware shouldn’t break existing data integrations or APIs
- Floor event updates: Sensors become out of synch with the physical workplace design will generate garbage. Be alert to changes in office layout that impact accuracy and adjust commissioning ASAP
Multi-Vendor Interoperability
The best sensing infrastructure doesn’t lock you into a single sensor technology. Over time, you might need sensors from different types, different vendors, retire older equipment, or experiment with new data needs. Multi-technology architecture requires:
- Common data schema: All occupancy data, regardless of sensor source, should conform to the same schema (JSON, time-series format)
- Protocol independence: Use standard protocols, from BLE to Thread or LoRaWAN for data streaming, not proprietary protocols; REST APIs should follow REST conventions, not vendor-specific formats
- Metadata standards: Device metadata (location, type, configuration) should be discoverable and standardized across all devices
- Testing and certification: Vendors should certify interoperability with your BMS, IWMS, and other critical systems
Preparing for AI-Driven Workplace Automation
Occupancy data is the foundation for automated workplace systems: HVAC optimization, lighting control, desk availability APIs, meeting room management. Modern buildings use AI to learn patterns and adapt in real time. Design your infrastructure to support this evolution:
- High-frequency data: Some automation requires occupancy updates at 1-5 second granularity, not 15-minute aggregates; ensure your data pipeline can support this
- Spatial resolution: Know not just how many but where—desk-level or zone-level positional data enables more sophisticated automation
- Multi-layer tagging: occupancy can be related to organization, building and furniture, crossing neighborhood and floors.
- Historical data retention: AI models are trained on historical patterns; retain 6-12 months of occupancy data for model development
- Feedback loops: Automation systems need to validate decisions (did HVAC adjustment help occupant comfort?); ensure data flows back from BMS to analytics
Frequently Asked Questions
What is workplace sensing infrastructure?
Workplace Performance Sensing System is the integrated technical framework—sensors, communication protocols, edge processing, and data integration layers—that enables organizations to capture and act on real-time occupancy and space utilization data. It encompasses the physical sensors, the networks they communicate over, the edge processing that happens locally, the data transport (MQTT, APIs), and the analytics infrastructure to consume the data.
How does occupancy data flow from sensor to dashboard?
Data flows through five layers: (1) the sensor detects occupancy and processes it locally (edge AI), (2) the processed occupancy count is transmitted via a communication protocol (PoE, Thread, Wi-Fi), (3) it might reach a gateway or network edge (in case of wireless communication), (4) it is transported to cloud systems via MQTT and (5) it appears via REST API in your BMS, IWMS, or custom dashboard for analysis and action. In a software-agnostic architecture, multiple applications can subscribe to the same data stream simultaneously.
What is the difference between edge processing and cloud processing?
Edge processing means algorithms run locally on the sensor or gateway; the sensor detects raw data (images, wifi signal or thermal arrays) and outputs only the results (occupancy count). Cloud processing means raw or minimally processed data is sent to centralized servers for analysis. Edge processing is more private and efficient; cloud processing offers more flexibility but raises privacy and data residency concerns. Best practice: use edge processing for privacy-sensitive detection, cloud processing for aggregation and analytics.
What communication protocols do occupancy sensors use?
Common protocols include Power-over-Ethernet (PoE) for wired deployments, Thread for wireless mesh, Wi-Fi for existing infrastructure, BACnet for building system integration, Zigbee or LoRaWAN for legacy systems, and cellular for remote areas. PoE and Thread are the most common in modern deployments. The choice depends on infrastructure availability, power requirements, and integration needs. Many systems support multiple protocols simultaneously.
How do MQTT and REST APIs work with occupancy data?
MQTT is a publish-subscribe protocol: sensors publish occupancy data to topics (e.g., building/floor2/occupancy), and any subscriber (cloud system, BMS, analytics platform, mobile app) receives updates in real time. REST APIs or Webhooks use request-response: applications subscribe for the data or query the sensor system for current occupancy and receive a response. MQTT is ideal for streaming real-time data; REST is better for ad-hoc queries. Most modern systems support both for maximum flexibility.
What is Thread mesh networking for buildings?
Thread is a low-power, self-healing wireless mesh protocol designed for building IoT. Sensors form their own mesh network, automatically routing around obstacles and failed devices. A single Thread border router provides connectivity to the internet; sensors handle internal routing. Thread offers low power (batteries last 2-5 years), simple installation (no cabling), and robust coverage. It is particularly well-suited for open offices, temporary spaces, and areas without existing network infrastructure.
How does software-agnostic sensing prevent vendor lock-in?
Software-agnostic sensing uses open communication protocols (MQTT, REST) and open data formats (JSON, standard schemas) instead of proprietary formats. This means occupancy data flows freely from sensors to any application that needs it—your BMS, analytics platform, facilities app, or a future system you have not chosen yet. You can swap sensor manufacturers, analytics vendors, or integration tools without rearchitecting your infrastructure. Open standards ensure data portability and competitive choice.
What privacy architecture should workplace sensors use?
Privacy-first architecture is built on edge processing: sensors with cameras or infra red imaging process data locally and transmit only derived results (occupancy counts, anonymized positions, movement), not raw images or thermal data. Data minimization is enforced at the sensor: collect and transmit only occupancy, not identification or tracking. This approach satisfies GDPR data minimization principle, CCPA consumer privacy protections, and builds employee trust by ensuring raw data never leaves the sensor.
